
AI Summary
Are you trying to pick the best web analytics tools so you can understand your traffic, your visitors, and what’s actually working on your website?
After twenty years of building WordPress websites and writing about analytics and email deliverability, I’ve installed, configured, and lived inside most of the tools on this list. Some are free, some cost as much as a small car, and the right one for you depends far more on what you want to learn than on which has the longest feature list.
To keep this list honest, I judged every tool on three things: the depth of the data and insights you get, how easy it is to actually use day to day, and the pricing and value, including how usable the free plan is. I’ve also flagged which tools are genuinely privacy-friendly, since that matters more every year.
Best Web Analytics Tools in 2026
Below are my picks for 2026, from free all-rounders to enterprise platforms, plus the privacy-first and product-analytics options most older lists leave out.
What Are Web Analytics Tools?
Web analytics tools record and report what people do on your website, where they came from, which pages they visit, how long they stay, and what they do before they leave or convert. That data tells you who your audience is, what they want, and where your site is losing them.
Used well, that’s how you turn guesswork into decisions, fix the pages that quietly leak visitors, and double down on the content that brings people in. Most of these tools also let you track user behavior at an individual or segment level, not just count pageviews.
Fill the Data Gap With WP Mail SMTP
Analytics tells you whether visitors arrive and convert. It won’t tell you whether the emails your site sends after that conversion, order receipts, password resets, and form notifications, actually reach the inbox.
That’s the gap WP Mail SMTP fills. It routes every WordPress email through a verified SMTP provider so messages stop landing in spam or vanishing silently. The free Email Test and Domain Checker confirm your setup is sound, and WP Mail SMTP Pro adds Email Logging, open and click tracking, and instant failure alerts so you can track every email your WordPress site sends the same way you track your traffic.
Quick Overview: Best Web Analytics Tools at a Glance
Here’s how the 12 tools compare before you read the full reviews. Click any name to jump straight to its breakdown.
| Tool | Best For | Free Plan | Starting Price | Privacy-Friendly |
|---|---|---|---|---|
| Google Analytics | All-round website analytics | ✅ | Free | ❌ |
| MonsterInsights | WordPress sites | ✅ | $99.50/yr | ⚠️ |
| Microsoft Clarity | Heatmaps & recordings | ✅ | Free | ⚠️ |
| Matomo | Privacy & data ownership | ✅ (self-hosted) | €29/mo (cloud) | ✅ |
| Hotjar | Behavior & UX insights | ✅ | $32/mo | ⚠️ |
| Mixpanel | Product analytics | ✅ | Usage-based | ⚠️ |
| Amplitude | Funnel & retention analytics | ✅ | $49/mo | ⚠️ |
| PostHog | All-in-one product analytics | ✅ | Usage-based | ✅ |
| SimilarWeb | Competitor & market data | Limited | Quote-based | ❌ |
| OnePageGA | Simplifying GA4 | Trial | $10/mo | ⚠️ |
| Adobe Analytics | Enterprise | ❌ | Quote-based | ❌ |
| Kissmetrics | Ecommerce behavior | ❌ | ~$500/mo | ❌ |
1. Google Analytics
Google Analytics is the default starting point for almost every website owner, and for most people it’s still the right one.

The current version, GA4, replaced the old Universal Analytics in 2023, so any guide still showing UA screenshots is out of date. GA4 follows visitors from the search result or ad that brought them in all the way through to a conversion or exit, and it connects to the rest of Google’s stack, Google Ads, Tag Manager, and Looker Studio, without extra cost.
My Experience
The real-time and user-activity reports are the part I check most, since they show traffic and behavior as it happens. You can monitor average engagement time, scroll depth, and event counts per page, and GA4 will flag sudden spikes or drops so you notice a problem the same day it starts.

The trade-off is the learning curve. GA4’s event-based model and report layout are genuinely confusing at first, and building custom reports and dashboards takes time to get right.
Feature Breakdown
- Real-time reporting: Watch traffic and on-site activity as it happens.
- Custom reports: Build dashboards around the metrics your business cares about.
- Audience demographics: Segment by interests, location, device, and more.
- Conversion tracking: See which interactions lead to sign-ups and sales.
- Ecommerce tracking: Follow transactions and shopping behavior end to end.
Pricing and Plans
Google Analytics is free. You add the GA4 tag to your site and start collecting data immediately. Large enterprises that need higher data limits and a service agreement can move to Analytics 360, which is quote-based.
Expert Review
For the vast majority of websites, Google Analytics is the answer. It’s free, comprehensive, and works with everything else you’re likely to use. The two honest caveats are the learning curve and the privacy question, since you’re handing Google full access to your visitor data. If either is a dealbreaker, the next few picks solve for exactly that.
2. MonsterInsights
If you run a WordPress site, MonsterInsights is the easiest way to get Google Analytics working properly without touching code.

It’s the most popular Google Analytics plugin for WordPress, and it does two things well: it connects GA4 to your site correctly in a few clicks, and it pulls the reports that matter back into your WordPress dashboard so you’re not constantly switching to the Google Analytics interface.
My Experience
Having traffic, top posts, and conversion data inside the WordPress admin saves a real amount of time when you manage several sites. The ecommerce tracking is the standout, since it surfaces transactions, revenue, and best-selling products in one report without custom GA4 configuration.

The popular-posts report is the other one I lean on, because it shows which content is actually connecting with readers so you know what to write more of.
Feature Breakdown
- Code-free GA4 setup: Connect Google Analytics without editing theme files.
- Dashboard reports: Read your key stats inside WordPress.
- Ecommerce tracking: Get revenue and product data with one-click setup for WooCommerce and Easy Digital Downloads.
- Search and popular-post tracking: See what people search for and which posts perform.
Pricing and Plans
MonsterInsights has a free version that covers basic tracking. Paid plans start at $99.50/year for Plus (1 site), $199.50/year for Pro (5 sites, ecommerce tracking), and $399.50/year for Agency (25 sites). Those are first-year introductory rates that roughly double on renewal, so check the renewal price before you commit.
Expert Review
Best if your priority is WordPress. MonsterInsights doesn’t replace Google Analytics, it makes it usable for people who live in the WordPress dashboard and don’t want to learn GA4 from scratch. For a WordPress site owner who wants real reports without a developer, it’s the pick I’d reach for first.
3. Microsoft Clarity
Microsoft Clarity answers a question traffic numbers can’t: what are people actually doing on the page? And it does it for free.
Clarity is a behavior-analytics tool built around heatmaps and session recordings. Where Google Analytics tells you a page gets traffic but a low conversion rate, Clarity shows you the rage clicks, dead clicks, and abrupt exits that explain why.
My Experience
The setup is about as simple as analytics gets, a single tracking script or a WordPress plugin, and recordings start populating within minutes. The heatmaps make it obvious where attention goes and where people give up, and the “rage click” and “excessive scrolling” filters jump you straight to the sessions worth watching instead of scrubbing through hundreds.
Because it’s a Microsoft product, it also ties into the wider Microsoft advertising and Copilot stack, though you don’t need any of that to use it.
Feature Breakdown
- Heatmaps: See where visitors click, scroll, and stop.
- Session recordings: Watch real visits to spot friction you’d never catch in a report.
- Frustration signals: Filter for rage clicks, dead clicks, and quick backs.
- Unlimited traffic: No sampling or session caps on the free plan.
Pricing and Plans
Clarity is completely free, with no traffic limits and no paid tier. Microsoft offers it at no cost in exchange for keeping you in its ecosystem.
Expert Review
Best if your priority is understanding behavior without spending anything. Clarity isn’t a full traffic-analytics platform, so you’ll run it alongside Google Analytics rather than instead of it. But as a free companion that shows you why pages underperform, nothing else matches the value.
4. Matomo
Matomo, formerly Piwik, is the analytics tool to choose when you want full ownership of your data.

You can self-host Matomo on your own servers, which means your visitor data never leaves your infrastructure, a real advantage if you operate under GDPR or similar rules. It covers the analytics fundamentals you’d expect, then adds the privacy controls most platforms don’t.
My Experience
The dashboard gives you clear traffic and behavior reporting out of the box, and the privacy features are the reason to pick it. With self-hosting, you own 100% of the data, and because Matomo is open-source you can extend it to fit an unusual reporting setup.

If you want the same privacy-first approach with less setup, the lightweight cookieless tools have caught up fast. Plausible starts at $9/month, and Fathom and the open-source Umami cover the same ground, all of them GDPR-friendly without a cookie banner. Pair any of them with a proper GDPR plugin and your compliance story gets a lot simpler.
Feature Breakdown
- Data ownership: Self-host so visitor data stays on your servers.
- Privacy compliance: GDPR-friendly tracking, with a cookieless option.
- Real-time data: Live reporting on visitors and behavior.
- Open-source: Customize and extend the platform freely.
Pricing and Plans
Self-hosted Matomo is free and open-source. The managed Matomo Cloud starts at €29/month for 50,000 hits, with pricing scaling by traffic and custom enterprise pricing above 10 million hits a month.
Expert Review
Best if your priority is privacy and data ownership. Matomo asks more of you than Google Analytics, especially if you self-host, but it’s the strongest pick for businesses in regulated industries or anyone who simply doesn’t want to hand visitor data to a third party.
5. Hotjar
Hotjar bridges the gap between the numbers and the human behind them, showing you how people actually experience your pages.

Like Clarity, Hotjar is built around heatmaps and session recordings, but it adds on-site surveys and feedback widgets so you can pair behavioral data with what visitors tell you directly. It’s worth knowing that Contentsquare acquired Hotjar in 2025, and the product is gradually moving onto Contentsquare’s unified platform.
My Experience
The dashboard surfaces sessions, time on page, and engagement without hunting through menus. The heatmaps and session recordings are the core draw, and the form-analysis report is genuinely useful, since it shows which fields people abandon so you can fix the ones killing your conversions.

The surveys and feedback polls round it out, letting you ask visitors what they think while they’re still on the page.
Feature Breakdown
- Heatmaps: See where attention and clicks concentrate.
- Session recordings: Replay real visits to find usability problems.
- Form analysis: Spot the fields that cause drop-off.
- Surveys and feedback: Collect direct input from visitors.
Pricing and Plans
Hotjar has a free Observe plan (up to 35 daily sessions). Paid Observe plans start at $32/month (billed annually), with Business and Scale tiers above that. As the product moves to Contentsquare, a unified Growth plan around $49/month is rolling out, so check which version you’re signing up for.
Expert Review
Best if your priority is understanding the experience and hearing from visitors in one place. Worth picking over Clarity if you want surveys and feedback alongside the heatmaps and can live with paying for higher session volumes.
6. Mixpanel
Mixpanel shifts the focus from pageviews to what users actually do, which makes it a product-analytics tool more than a website one.

It tracks events, builds conversion funnels, and measures retention, so it’s aimed at apps and SaaS products where the question is “where do users drop off” rather than “how much traffic did this post get.”
My Experience
Building a funnel takes a few clicks, and seeing exactly where people fall out of a sign-up or checkout flow is where Mixpanel earns its keep. It follows users across their whole journey so you can spot behavior patterns, and the reports are customizable enough to focus on the handful of metrics that matter instead of drowning you in data.

Feature Breakdown
- Event tracking: Measure specific user actions, not just visits.
- Funnel analysis: See where users drop off in a flow.
- Retention reports: Track who comes back and when.
- Session replay and AI queries: Watch sessions and ask questions in plain language.
Pricing and Plans
Mixpanel’s free plan covers up to 1 million events a month. The Growth plan is usage-based, charging about $0.28 per 1,000 events beyond the first million, and Enterprise pricing starts around $25,000/year. Costs can climb quickly once add-ons like Group Analytics enter the picture, so model your event volume first.
Expert Review
Solid if you run a product or app and can live with the fact that this isn’t a content-site tool. For a blog or marketing site, Google Analytics tells you more for less. For a SaaS funnel, Mixpanel is in its element.
7. Amplitude
Amplitude is a product-analytics platform built for teams that want to understand and improve the entire user journey.

It tracks how users move through your product, visualizes funnels, and measures retention, with a stronger lean toward predictive analysis than most of its rivals.
My Experience
The behavioral reporting digs beneath surface metrics to show why users do what they do, which is the part that actually informs content and product decisions. The pathway view follows users from first visit to conversion or exit, so you can see where your navigation and flow help or hurt.

The predictive models are the differentiator, estimating what users are likely to do next rather than only reporting what already happened.
Feature Breakdown
- Behavioral analytics: Understand the why behind user actions.
- Pathway tracking: Follow the full journey to conversion or exit.
- Retention monitoring: Measure loyalty and repeat usage.
- Predictive analytics: Forecast likely future behavior.
Pricing and Plans
Amplitude has a free plan for up to 50,000 monthly tracked users. The self-serve Plus plan is $49/month (billed annually), and the Growth tier is custom-priced. As with Mixpanel, real-world bills for larger teams tend to land well above the headline figure.
Expert Review
Solid for product teams that want prediction and deep journey analysis, with the trade-off that the value only shows up at product scale. If you’re choosing between Amplitude and Mixpanel, it often comes down to which interface your team prefers, since their core capabilities overlap heavily.
8. PostHog
PostHog has become the developer-favorite all-in-one platform, bundling product analytics, session replay, feature flags, and surveys into a single tool.
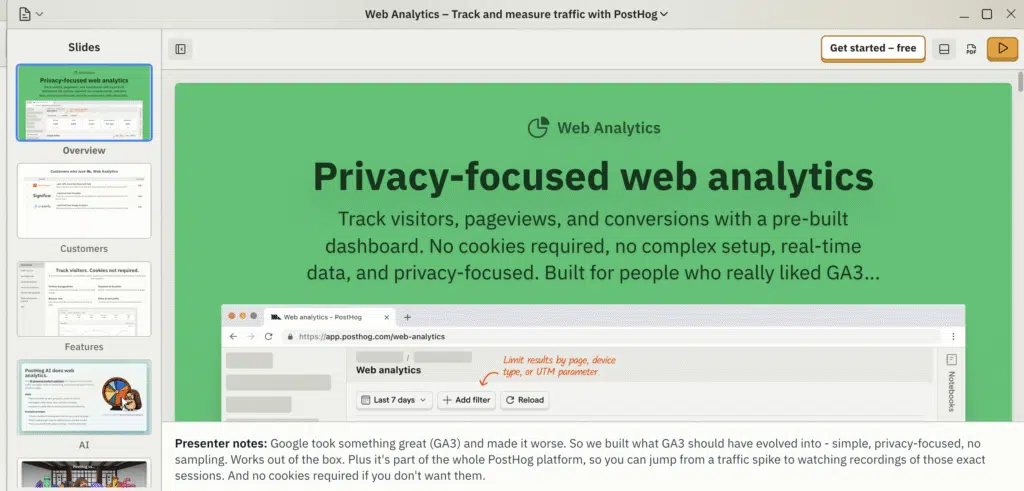
That breadth is the appeal. Instead of paying for Mixpanel plus Hotjar plus a feature-flag service, you get analytics, recordings, A/B testing, and experimentation in one place, and you can self-host it if you want your data in-house.
My Experience
The free tier is unusually generous, which is why so many teams never pay: 1 million events, 5,000 session recordings, and feature flags every month before any charge. The product-analytics side handles funnels, retention, and cohorts like the dedicated tools, and having feature flags and experiments built in means you can ship a change, flag it, and measure it without leaving the platform.
It leans technical, so it rewards teams with a developer in the loop more than a non-technical marketer.
Feature Breakdown
- Product analytics: Funnels, retention, and cohort analysis.
- Session replay: Watch real sessions alongside the data.
- Feature flags and experiments: Roll out and A/B test changes in-app.
- Self-hosting option: Keep data on your own infrastructure.
Pricing and Plans
PostHog is free for up to 1 million events a month, plus generous free allowances for recordings, feature flags, and surveys. Beyond that it’s usage-based, starting around $0.00005 per event with volume discounts that grow as you scale. You can set a billing cap per product to avoid surprise charges.
Expert Review
Best if your priority is consolidating several product tools into one, especially with a developer on the team. For a simple content site it’s more than you need, but for a product company it can replace three or four separate subscriptions.
9. SimilarWeb
SimilarWeb is less about your own site and more about everyone else’s, which makes it a competitive-intelligence tool first.

It estimates traffic, sources, and engagement for any website, so you can benchmark yourself against competitors and see where their visitors come from across organic search, paid, referrals, and social.
My Experience
The big-picture view across channels is what stands out, since it makes it easy to spot where a market is heading and which sources have the most room to grow. Being able to compare your site against competitors, then export tidy custom reports, is a real time-saver for strategy and pitch work.

The data is estimated rather than measured, so treat it as directional benchmarking, not precise truth.
Feature Breakdown
- Competitor traffic estimates: Benchmark any site’s traffic and sources.
- Market intelligence: Track industry trends and share of traffic.
- Channel breakdown: See organic, paid, referral, and social splits.
- Custom reports: Export benchmarking data for your team.
Pricing and Plans
SimilarWeb offers a limited free version and a browser extension. Most paid plans are now quote-based, and the entry Starter tier has historically started around $125 per user per month, billed annually.
Expert Review
Worth picking if competitive and market research is the goal, as long as you accept the data is estimated and the paid tiers aren’t cheap. It complements your own analytics rather than replacing them.
10. OnePageGA
OnePageGA exists to solve one specific problem. GA4 is powerful but exhausting to navigate.

It connects to your Google Analytics data and presents the metrics that matter on a single screen, so you skip the maze of GA4 menus and reports.
My Experience
The single-page dashboard does what it promises. It pulls your GA4 data into one clear view in well under a minute, and having traffic, top sources, landing pages, and revenue on one screen removes the constant clicking GA4 demands. For campaign work, seeing all your UTM parameters and comparing time periods in one place is faster than the equivalent in GA4 itself.
It’s a layer on top of Google Analytics rather than a replacement, so it’s only as good as the GA4 data feeding it.
Feature Breakdown
- One-page dashboard: All key metrics on a single screen.
- Instant GA4 reports: Top sources, channels, and landing pages at a glance.
- Customizable metrics: Choose the data points that matter to you.
- Campaign tracking: UTM monitoring and period comparisons.
Pricing and Plans
OnePageGA has a 14-day free trial with no card required. Paid plans are $10/month ($100/year) for Personal, $20/month ($200/year) for Business with ecommerce and funnel reports, and from $28/month for the Agency plan covering multiple sites.
Expert Review
Worth picking if you have GA4 but never want to open it. It’s a niche, convenience-focused tool, so it makes most sense for small businesses and agencies that need quick, readable answers without the GA4 learning curve.
11. Adobe Analytics
Adobe Analytics sits at the enterprise end of the market, built for organizations that need to track far more than website visits.

It covers websites, mobile apps, audio and video engagement, and social interactions, then stitches them into a single cross-channel view of the customer journey.
My Experience
The depth of segmentation and the precision of the metrics are a clear step beyond standalone tools. The customer-journey analytics, which visualizes the full path from first touch to purchase and beyond, is the headline capability, and the integration with other Adobe products like Experience Manager and Target is what makes it powerful for teams already in that stack.

All of that power comes with real complexity, and it expects dedicated analysts to run it well.
Feature Breakdown
- Cross-channel tracking: Web, app, video, and social in one view.
- Customer-journey analytics: Visualize the full path to conversion.
- Predictive analytics: Machine-learning forecasts on your data.
- Adobe integration: Works tightly with Experience Cloud products.
Pricing and Plans
Adobe doesn’t publish pricing. It’s quote-based through Adobe Experience Cloud and aimed squarely at mid-market and enterprise budgets.
Expert Review
Adobe Analytics has a place if you’re an enterprise already invested in Adobe’s stack and need cross-channel depth. For everyone smaller, it’s far more tool, and cost, than the job requires.
12. Kissmetrics
Kissmetrics focuses on person-level behavior, tracking individual customers across devices rather than counting anonymous sessions.

It’s built for marketers and ecommerce teams who want to follow the actions that lead to conversions and find the bottlenecks in their funnels.
My Experience
Kissmetrics ties activity to individual people, so you get a unified profile for each customer across the devices they use, instead of fragmented session data. The dashboard breaks down purchases and revenue by channel, and the cohort analysis, funnel reports, and built-in A/B testing give you behavioral detail that pageview-focused tools miss.

Feature Breakdown
- Person-level tracking: Follow individual customers, not just sessions.
- Multi-device profiles: Unify a customer’s activity across devices.
- Funnel and cohort reports: Find conversion bottlenecks.
- A/B testing: Compare variations and measure impact.
Pricing and Plans
Kissmetrics is enterprise-focused, with plans that generally start around $500/month and scale up based on event volume and features.
Expert Review
Has a place if you run a serious ecommerce operation and need granular, person-level behavioral data, otherwise the product-analytics picks above deliver similar insight for less. The price puts it out of reach for most small businesses.
FAQs About the Best Web Analytics Tools
Web analytics is a popular topic among our readers. Here are quick answers to the questions that come up most when choosing a tool.
What is the best free web analytics tool?
Google Analytics is the most capable free option for overall website analytics, and it’s free at essentially any traffic level. For free behavior insights like heatmaps and session recordings, Microsoft Clarity is the best free companion to run alongside it.
Is Google Analytics being discontinued?
No. The old Universal Analytics was retired in 2023, and GA4 is the current version. GA4 is actively developed and remains free, so the only thing that ended was the previous generation of the product.
What is the best privacy-friendly web analytics tool?
Matomo is the most established privacy-first platform, especially self-hosted, since your data never leaves your servers. Plausible, Fathom, and Umami are lighter cookieless alternatives that are GDPR-friendly without a cookie banner.
What is the difference between web analytics and product analytics?
Web analytics tools like Google Analytics measure traffic and content performance, who visits and which pages they read. Product analytics tools like Mixpanel, Amplitude, and PostHog measure what users do inside an app or product, tracking events, funnels, and retention.
Can web analytics tools improve my conversion rate?
Yes. Features like heatmaps, session recordings, funnel reports, and A/B testing show you where visitors hesitate or leave, so you can fix the specific pages and steps that lose conversions.
Next, Get More Eyes on Your Site With the Right SEO Plugins
Once you know what your visitors do, the next step is bringing more of them in. A solid setup of the best WordPress SEO plugins helps you rank for the searches your audience is already making, so your analytics has more traffic to measure.
And whichever analytics tool you choose, make sure the emails your site sends are actually arriving. WP Mail SMTP fixes WordPress email deliverability so your receipts, notifications, and password resets reach the inbox instead of the spam folder.
Ready to fix your emails? Get started today with the best WordPress SMTP plugin. If you don’t have the time to fix your emails, you can get full White Glove Setup assistance as an extra purchase, and there’s a 14-day money-back guarantee for all paid plans.